
A low P/E ratio can reflect deeper structural risk rather than true undervaluation.
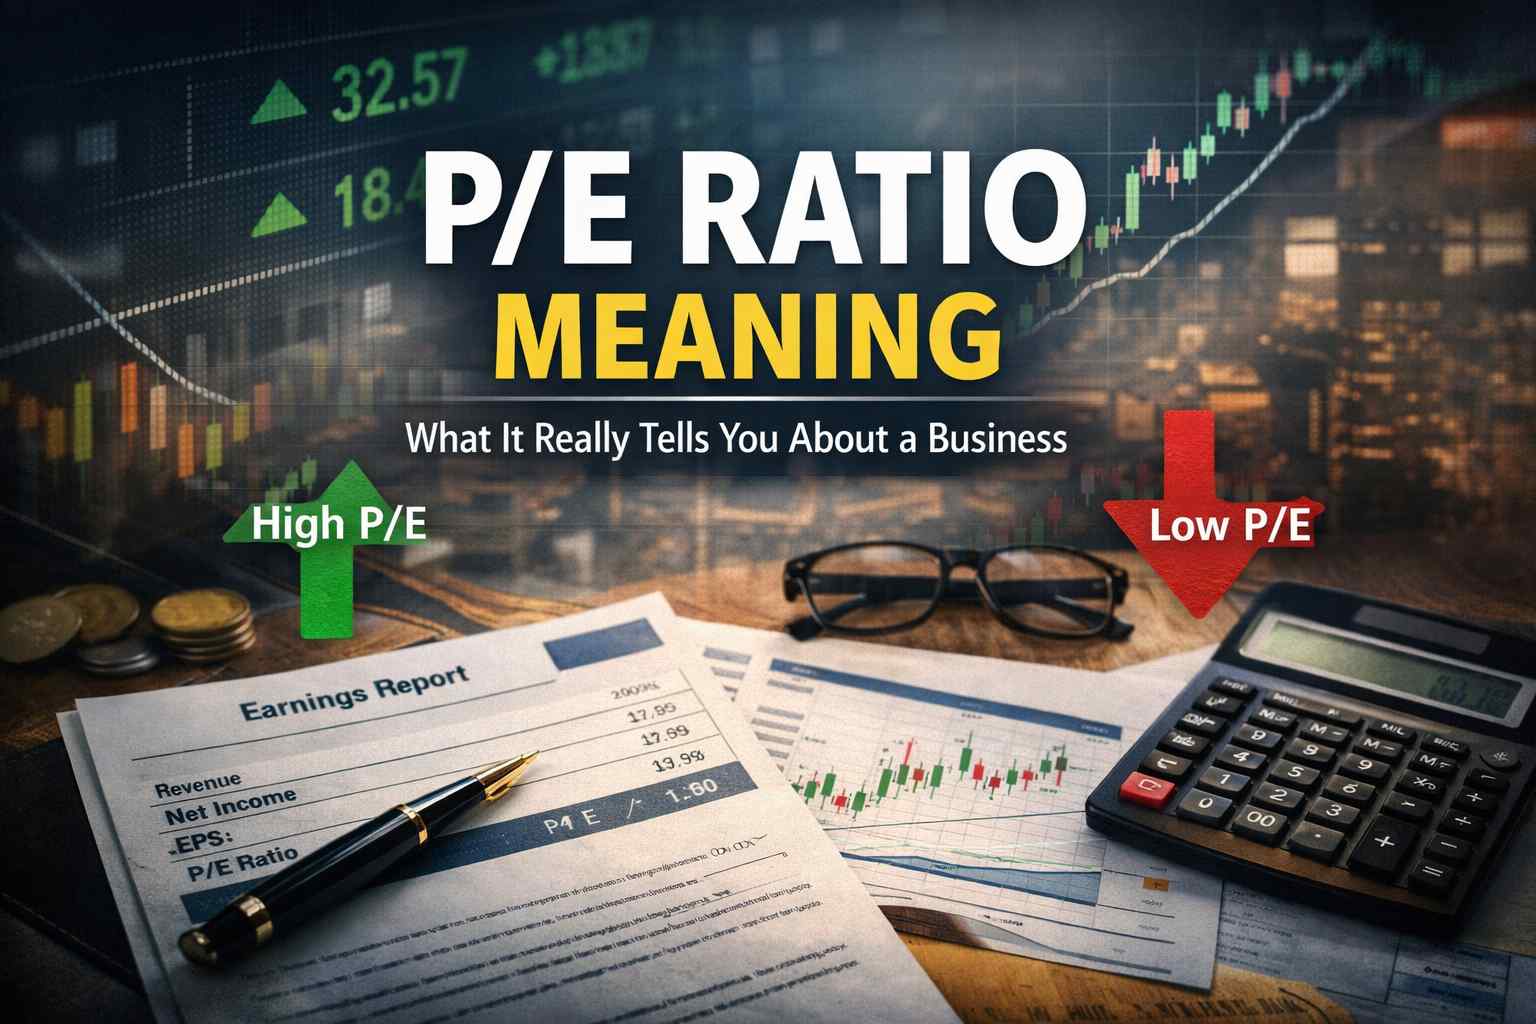
A stock trading at 8× earnings feels like a safer bet than one trading at 30×.
The logic seems obvious. You are paying less for the same unit of earnings, so the downside appears limited.
But that intuition hides a deeper assumption — that the “E” in the P/E ratio is stable, reliable, and representative of the future.
In reality, that assumption is often wrong.
And when it is wrong, a low P/E ratio stops being a margin of safety and starts becoming a source of hidden risk.
Why This Matters for Investors
Valuation is not about finding the cheapest number. It is about understanding why a number is cheap.
A low P/E ratio can signal opportunity. It can also signal deteriorating business quality, cyclical peak earnings, balance sheet stress, or capital allocation problems.
If an investor treats low P/E as a shortcut to “margin of safety,” they may be concentrating risk instead of reducing it.
This matters because valuation errors rarely come from complex models. They usually come from oversimplified interpretations of simple ratios.
What the P/E Ratio Actually Represents
The P/E ratio reflects how much investors are willing to pay today for one dollar of reported earnings.
That sounds straightforward. But embedded in that number are several assumptions:
- Earnings are sustainable.
- Earnings are not at a cyclical peak.
- Capital intensity is manageable.
- Future growth is stable or improving.
- Balance sheet risk is limited.
- Management allocates capital rationally.
When these assumptions weaken, the P/E falls. Not because the stock is ignored, but because the market demands compensation for uncertainty.
A low P/E is not a verdict. It is a question.
The Psychological Trap of “Cheap”
Retail investors are naturally drawn to relative comparisons.
If one company trades at 8× earnings and another trades at 25×, the cheaper one feels safer.
This tendency illustrates why most beginner stock analysis guides fail in real markets, because they reduce investing to checklist ratios instead of probabilistic reasoning.
But lower price does not equal lower risk.
Consider two simplified examples:
Company A:
- Stable demand
- Low reinvestment needs
- Strong balance sheet
- Predictable margins
Trades at 24× earnings.
Company B:
- Highly cyclical revenues
- Heavy capital expenditure requirements
- Debt-funded expansion
- Margins fluctuate with commodity prices
Trades at 8× earnings.
The multiple difference is not random. It reflects business quality, volatility, and required returns.
Many investors see 8× and think “discount.” They fail to ask: discount to what?
When a Low P/E Ratio Works Well
There are situations where low P/E can signal mispricing:
- Temporary earnings dip due to short-term noise.
- Market overreaction to one-off events.
- Strong balance sheet despite negative sentiment.
- Structural turnaround with improving capital discipline.
In such cases, the earnings base is likely to normalize or improve, while the multiple remains compressed.
But identifying these situations requires business judgment, not ratio comparison.
A low P/E only works when the earnings denominator is stable and the risks are mispriced — not when the risks are real.
Where Surface-Level Analysis Breaks Down
The most common analytical mistake is treating reported earnings as durable.
“This stock trades at 6× earnings.”
That statement assumes the current earnings level is sustainable.
This looks reasonable until earnings are at a cyclical peak.
In commodity industries, shipping, semiconductors, and construction, profits can surge during favorable pricing environments. At the peak, P/E ratios look extremely low because earnings are temporarily inflated.
Investors mistake cyclical peak profits for normalized earnings power.
When the cycle turns, earnings collapse, and suddenly the 6× multiple was actually 25× on normalized earnings.
The problem is not the metric. The problem is the assumption behind it.
What This Looks Like in Practice
Consider a steel company at the peak of a commodity cycle.
Demand is strong, prices are elevated, and margins have expanded significantly. Earnings look unusually high, and the stock trades at 5× earnings. On the surface, it appears deeply undervalued.
Investors screen for low P/E stocks and find this name attractive. The low multiple creates a sense of downside protection.
But the multiple is low because earnings are temporarily inflated.
As supply catches up and pricing normalizes, margins compress. Earnings fall sharply over the next few quarters.
The same stock that looked cheap at 5× earnings was actually expensive relative to its normalized earnings power.
The loss does not come from multiple contraction. It comes from earnings collapsing.
Capital Intensity: The Hidden Distortion
Another issue most articles ignore is reinvestment burden.
Two companies can have identical earnings and identical P/E ratios. But if one must reinvest 80% of its operating cash flow just to maintain production capacity, its true economic flexibility is lower.
High capital intensity reduces the meaning of “cheap.”
If a business constantly needs external financing or heavy reinvestment to sustain earnings, the P/E ratio overstates actual distributable value.
This is closely related to how investors should think about free cash flow, where flexibility and self-funding ability define real economic strength.
On paper, earnings look attractive. In practice, cash availability is constrained.
Balance Sheet Risk Changes the Meaning of P/E
A low P/E combined with high leverage is not conservative. It is amplified equity risk.
Debt magnifies earnings volatility. It reduces margin for error. It increases sensitivity to economic downturns.
If equity trades at 7× earnings but net debt is significant, the enterprise may not be as cheap as it appears.
This is where free cash flow as a measure of business risk becomes relevant, because valuation cannot be separated from financial resilience.
Many retail investors screen for low P/E without adjusting for debt load. That disconnect leads to false comfort.
Two Analysts, Same Stock, Different Conclusions
Imagine a company trading at 9× earnings in a cyclical industry.
Analyst 1:
- Believes earnings are at mid-cycle.
- Sees improving cost discipline.
- Expects moderate demand recovery.
- Concludes valuation is conservative.
Analyst 2:
- Believes earnings are near peak.
- Sees pricing pressure emerging.
- Expects margin compression.
- Concludes valuation is misleading.
Both analysts use the same P/E ratio. The difference lies in assumptions about earnings durability.
Valuation is never about the ratio alone. It is about the interpretation of forward economics.
Reasonable professionals can disagree because they are making different probabilistic judgments, not arithmetic errors.
What Most Investors Miss
Second-order effects often distort low P/E narratives.
- Incentive misalignment
Management teams in “cheap” companies sometimes pursue aggressive acquisitions or financial engineering to justify valuation, increasing risk. - Structural decline masked by temporary profitability
Businesses facing technological disruption can appear cheap while their long-term earnings power erodes. - Capital allocation quality
If excess cash is reinvested poorly, low valuation does not translate into shareholder returns.
The multiple does not capture qualitative decay.
What Investors Should Stop Focusing On
- Stop comparing P/E across unrelated industries.
A regulated utility and a software company operate under completely different economic models. Relative P/E comparison without business context is meaningless. - Stop assuming lower P/E automatically implies margin of safety.
True margin of safety comes from earnings durability and balance sheet resilience, not just low multiples. - Stop treating trailing twelve-month earnings as normalized.
Reported earnings often reflect temporary pricing environments, accounting timing, or cost cycles. - Stop ignoring reinvestment requirements.
Earnings that must be reinvested heavily are economically different from earnings that can be distributed or deployed flexibly.
The discipline is not about finding low numbers. It is about interrogating what the number hides.
When High P/E Is Actually Less Risky
This sounds counterintuitive, but there are cases where a 25× multiple carries less risk than a 7× multiple.
Businesses with:
- Recurring revenue
- Strong pricing power
- Low capital intensity
- Conservative leverage
- Durable competitive advantages
often deserve structurally higher multiples because their earnings volatility is lower.
The market prices predictability.
Retail investors sometimes underweight stability and overweight nominal cheapness.
Risk is not about how much you pay relative to earnings today. It is about how uncertain those earnings are tomorrow.
The Core Analytical Shift
Instead of asking, “Is this stock cheap based on P/E?” a more useful question is:
“What has to be true about earnings durability for this P/E to make sense?”
This reframing aligns with how to analyze a US stock without too many metrics, where business judgment comes before ratio comparison.
It forces investors to examine:
- Revenue drivers
- Cost structure flexibility
- Competitive positioning
- Balance sheet structure
- Capital allocation behavior
- Industry cyclicality
The P/E ratio becomes an output, not a starting point.
A Practical Analytical Checklist (Without Turning It Into a Formula)
Before concluding that a low P/E represents opportunity, an investor should evaluate:
- Are current earnings above, below, or near mid-cycle?
- How much capital is required to sustain operations?
- Is leverage amplifying equity volatility?
- Is the business structurally stable or facing disruption?
- Is management incentivized toward prudent capital discipline?
None of these questions can be answered by the ratio itself.
That is why low P/E screening, by itself, often leads investors toward businesses with hidden fragility.
Key Takeaways
- A low P/E ratio is a signal of market skepticism, not automatic undervaluation.
- Earnings durability matters more than earnings magnitude.
- Capital intensity and leverage reshape what “cheap” truly means.
- Cyclical peak profits frequently create misleading low multiples.
- High-quality, stable businesses can justify structurally higher valuations with lower risk.
- The analytical work begins after you see the ratio — not before.
Frequently Asked Questions
Is a low P/E ratio always a value trap?
No. It can represent opportunity when earnings are temporarily depressed and business fundamentals remain intact. The distinction depends on durability, not the ratio alone.
Should investors ignore P/E ratios entirely?
No. P/E is a useful summary metric. The mistake is treating it as a conclusion instead of a starting point.
How can I tell if earnings are cyclical?
Look at multi-year revenue, margin trends, industry supply dynamics, and historical volatility. If earnings fluctuate significantly across economic cycles, trailing P/E is unreliable.
Does debt always make low P/E risky?
Not always. Moderate leverage in stable businesses can be manageable. The risk increases when earnings are volatile and debt obligations are fixed.
Why does the market assign higher multiples to some companies?
Higher multiples typically reflect confidence in earnings predictability, capital efficiency, and competitive durability.
What the P/E Ratio Is Actually Asking You
A low P/E ratio is not pointing you toward a bargain. It is asking a question.
Why are earnings priced this way?
Sometimes the answer lies in cyclicality, sometimes in structural weakness, and sometimes in risks that are not immediately visible in reported numbers.
The role of the investor is not to react to the multiple, but to understand the assumption embedded within it.
Because valuation is not about finding low numbers.
It is about understanding what those numbers are quietly implying about the future.